What is a spectrogram?
The spectrogram is a Fourier Transform of the raw audio signal and tells us about its frequency content as a fonction of time. Basically, it is obtained by running a FFT (Fast Fourier Transform) on the raw data. Time is along the x-axis and frequency along the y-axis. The power is color-coded. At BISA, we have developed a code to produce our own spectrograms that you can find e.g. in the BRAMS data viewer. The following parameters are used :
- The sample rate S = 5512 Hz (5512 samples per second)
- Total number of points N comes from the WAV files itself. Since we register audio WAV files every 5 minutes, this number is close to 300 x 5512 = 1653600
- Window W : the number of points on which the FFT is performed. We use 16384 points (2^14).
- Overlap OV = 90% of W which means ~ 14776 points are considered (0.9 x 16384). This is the number of common points used in two consecutive FFT. It is used to smooth the spectrogram.
Without overlap, the time resolution Δt is given by W/S ~ 3 seconds. However, the number of columns (pixels along x-axis) in the spectrograms is given by (N-OV)/(W-OV) ~ N/0.1W in case of a 90% overlap ~ 1000, which gives an "apparent time resolution" Δt' ~ 0.3 seconds (~300/1000). This is done only to improve the appearance of the spectrogram. The power is simply spread over consecutive smaller columns.
The spectrograms generated are PNG images and have a typical size of ~ 200 KB. Note that the spectrograms generated in the BRAMS viewer have a dynamical range for power, which means that the color code visible on the right hand side of the spectrogram depends on the minimum and maximum values of the spectrogram. This can be sometimes a problem when there are very bright pixels or if the level of the noise in the image is large. The units of the power are in dBFs (decibels relative to full scale, 0 dBFs = maximum value).
Below is an example of a typical spectrogram obtained at BEOVER on 09/12/2019 at 07H30 UT :
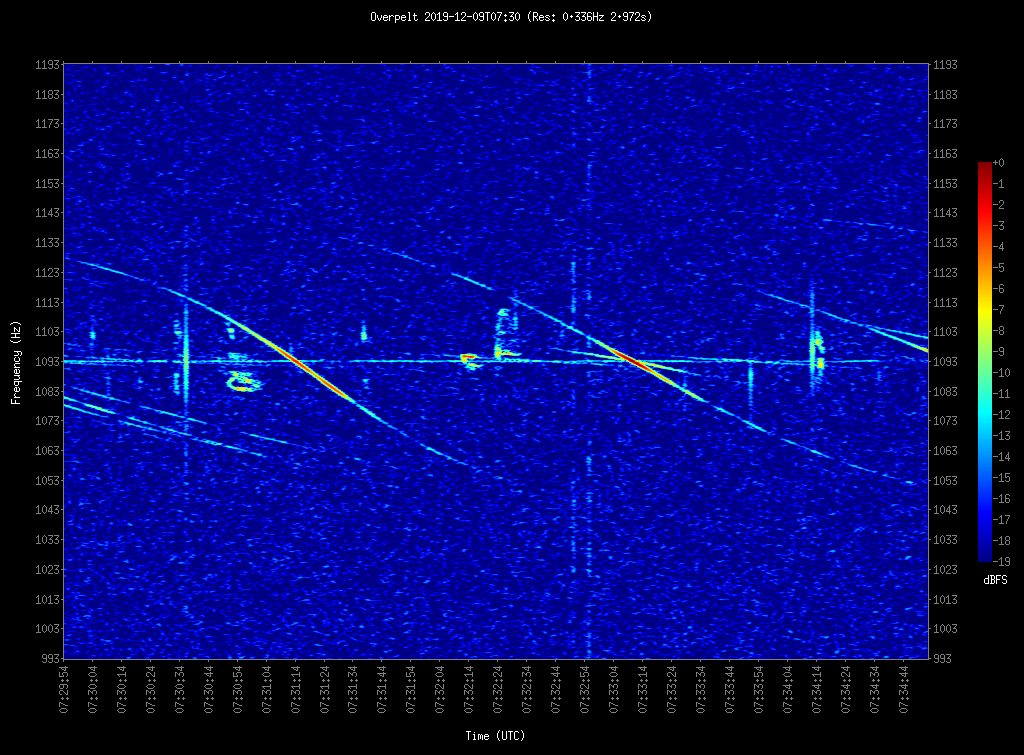
- The horizontal line at 1093 Hz is the frequency of the beacon, transmitted either directly on the ground and/or through some tropospheric propagation. The raw data have been obtained with an ICOM-R75 for which the stability of the LO is not perfect and varies with the internal temperature of the receiver. With RSP2 receivers locked with a GPDO reference, this signal would appear at 1000 Hz exactly.
- The short vertical lines are meteor echoes (4-5 visible on this spectrogram). Most of these are probably underdense meteor echoes with a short duration (just a fraction of a second). However, on the spectrogram it is not possible to confirm it unambiguously as the time resolution is only of ~3 seconds. To confirm this, we must isolate the frequencies spanned by the meteor echo and filter all other frequencies in the raw data to obtain a clean meteor profile (power versus time).
- There are a number of long-lasting meteor echoes with various complex shapes. These are overdense meteor echoes. Five of them are visible on this spectorgram.
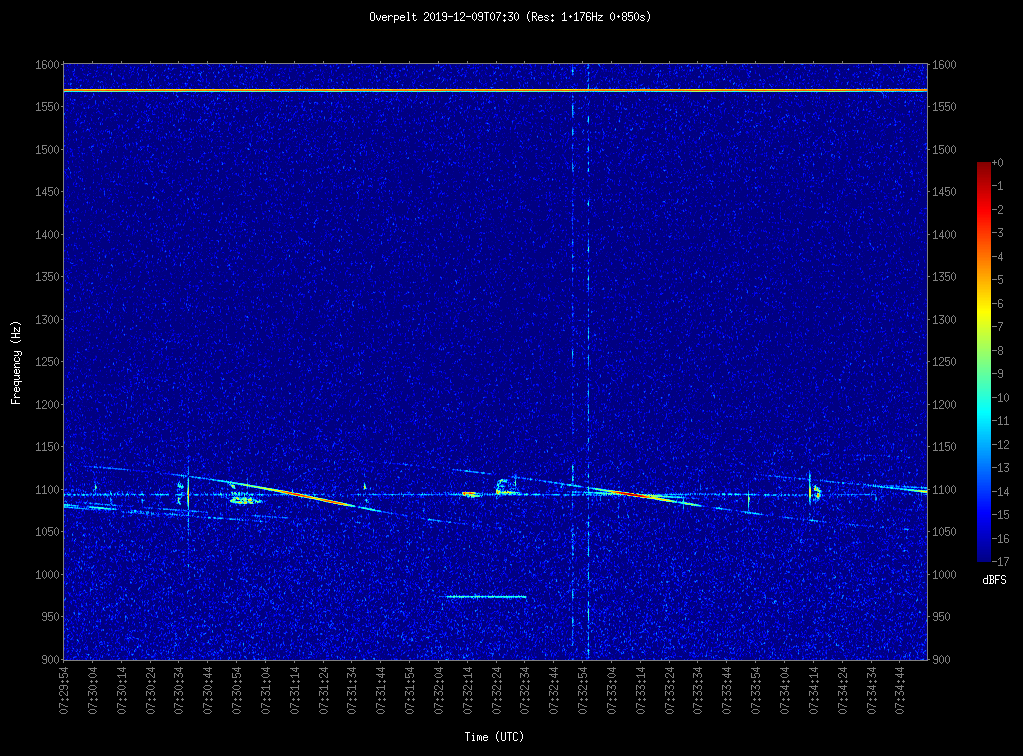
- The two long vertical (interrupted) lines at around 07:32:50 UT are broad-band interference. It is easy to discriminate from meteor echoes as they span the whole 200 Hz range.Actually, when we change the range of frequencies (see spectrogram below), we see these signals cover from at least 900 Hz to more than 1.7 KHz.
- Long-lasting echoes with a sort of "S-shape" are reflections on airplanes illuminated by the beacon. The S-shape can be explained simply by a double Doppler effect (from the plane moving in relation to the beacon and also to the receiving station). The classical S-shape is obtained for planes moving in straight line while for those changing directions, the form of the echo can be more complicated. In the example above, at 8 reflections on planes are recorded.
- Also visible on the enlarged spectrogram below is the signal from the BRAMS calibrator which appears 500 Hz above the direct signal.
Parameters recommended to visualize a spectrogram
Most interesting signals appear in a frequency range of 200 Hz centered on the frequency of the beacon (direct signal), with the noticeable exception of head echoes that expand to higher frequencies but are rare and rarely visible with BRAMS data. If you have set up the frequency of the local oscillator at 49.969 MHz (1 KHz below the frequency of the Dourbes beacon), the frequency of the beacon should in principle appear around 1000 Hz in the spectrograms.
In practice, the accuracy of the frequency of the local oscillator in the ICOM receiver is within a few tens of Hz and varies with the temperature. So the frequency of the beacon typically appears above 1 KHz (see example above where it appears at 1092 Hz). This frequency shift may also change with time, due to temperature effects in the ICOM-R75 receiver. This can be clearly seen between summer & winter spectrograms or simply between day & night. To avoid these effects as much as possible, it is recommended to place the receiver in a room more or less controlled in temperature.
Note that with the BRAMS 2.0 stations using RSP2 receivers disciplined by a 24 MHz reference provided by a GPSDO, this problem does not occur anymore.
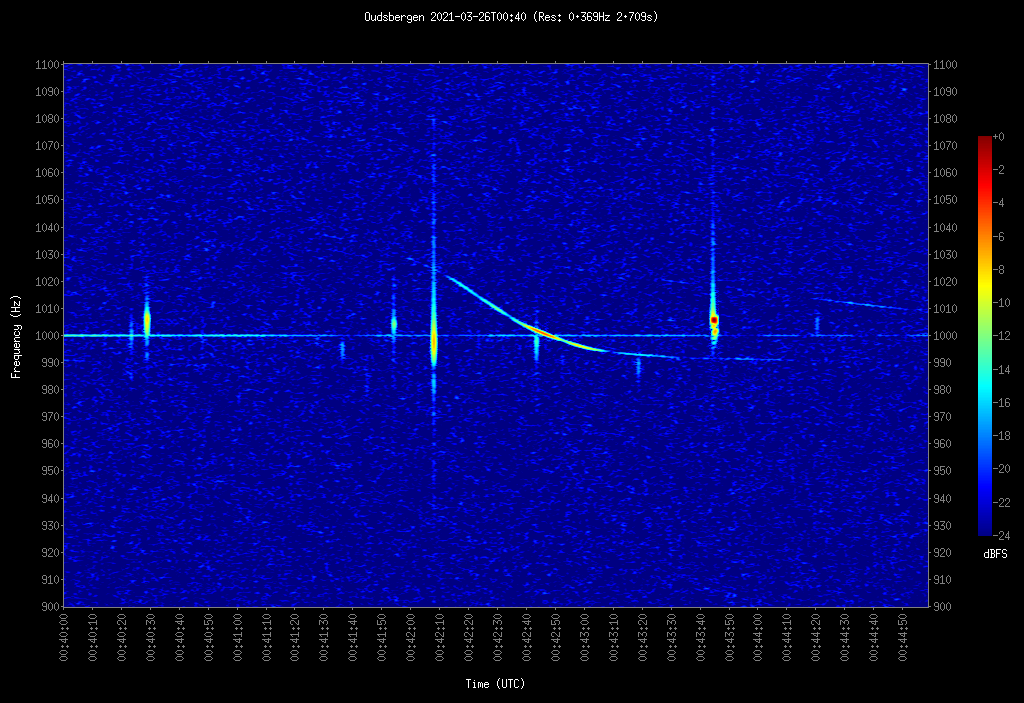
Below is one example of a spectrogram obtained at BEOUDS on March 26 2011 at 00:40 UT which shows that the direct signal coming from the transmitter appears at 1000 Hz with the RSP2 receiver and GPSDO.